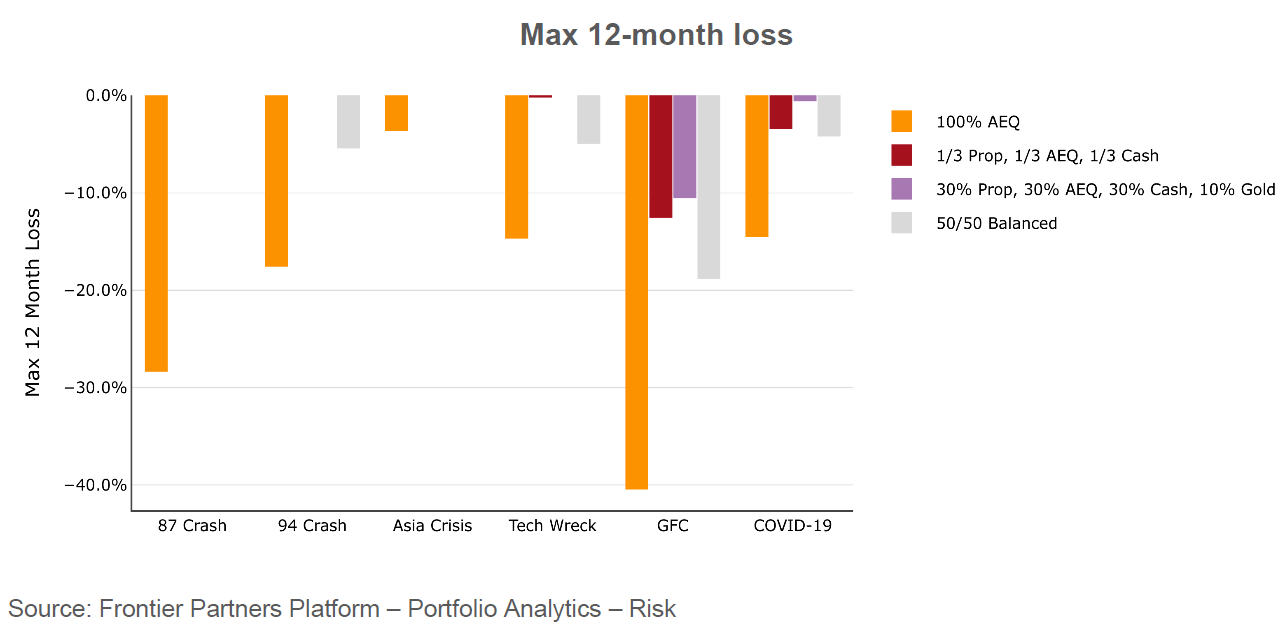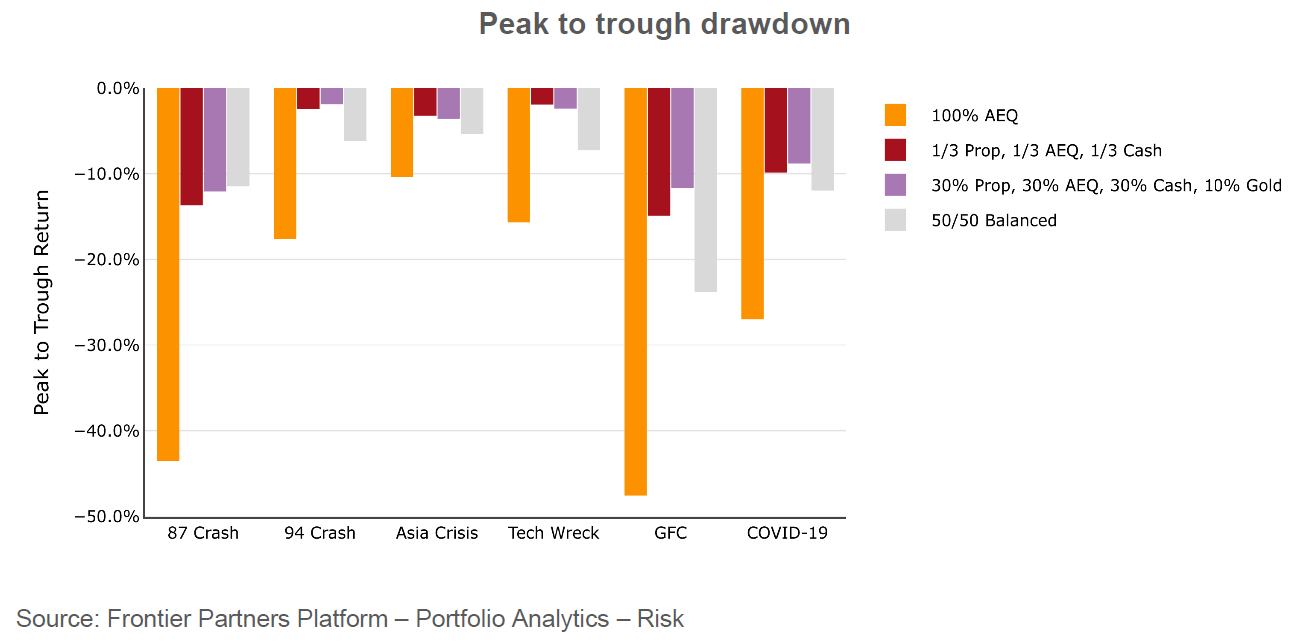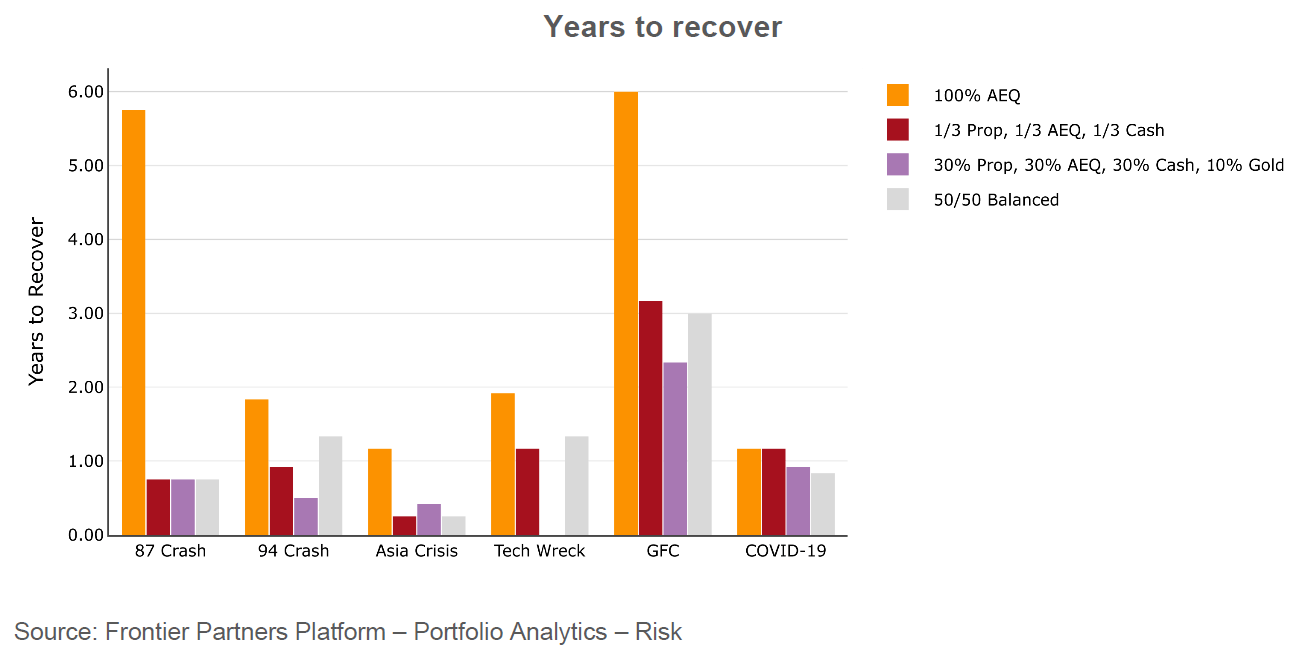
We thought we’d examine the “October effect” which is the belief October is historically the ‘bogey month’ for market stress. Now we’ve made it to November, it appears that for this year we’ve escaped unscathed.
As far back as 1907, October saw the “Bankers Panic” or “Knickerbocker Crisis” when over three weeks the New York Stock Exchange fell almost 50% from its peak the previous year. Then in October 1929, Wall Street saw three days of dramatic equity market crashes in less than week with “Black Thursday” producing an 11% loss on 24 October, followed by “Black Monday” (12.8% loss) and finally “Black Tuesday” (11.7%). Then, on the 19th of October 1987 the Dow Jones Industrials Index dropped 23% (USD terms) in a day, the largest one-day drop by percentage in the Index’s history and taking over the moniker of “Black Monday” and leading in to one of the first financial crises of the modern era.
On the fixed income side of the balance sheet, market purveyors were more focused on yields and concerned with movements in the long-end of yield curves. Some have compared the lead up to the current market situation to a period of economic expansion supported by a backdrop of low rates in the early-to-mid 90s. During that historical period, subsequent rate rises preceded yields increasing on the long end of the curves also, and saw 1994 being pinned as a debacle for bond markets. What is today known as the ‘The Great Bond Massacre’ is labelled as the “94 Crash” scenario in the charts below.
So, is October actually a bogey month for market stress? Probably not. What we understood very clearly with the October just passed is that equity markets were threatened by escalating war in the Middle East. Bond markets also expressed concern, demonstrated by yields moving higher on the long-end of curves. Regardless of any possible “October effect”, whether history will repeat or sing a rhyme, stress testing is useful in framing concerns at this time.
Let’s consider four possible portfolio allocations for the sake of illustration, in the context of the 87 crash along with five other notable financial market stress scenarios. These portfolio constructs are by no means indicative of the portfolio construction thinking of Frontier Advisors’ consultants and researchers. These are helpful in telling a story on the benefits of rather blunt diversification, through the backdrop of historical market stress.
For this illustrative purpose, our four sample portfolios are a 100% allocation to Australian Equities (“100% AEQ*); a naively diversified portfolio (“1/3 Prop**, 1/3 AEQ, 1/3 Cash”); a similar naively diversified portfolio with a significant allocation to gold (“30% Prop, 30% AEQ, 30% Cash, 10% Gold”); and a Balanced Portfolio with a 50 percent allocation to growth assets and the remainder allocated to defensive asset classes (“50/50 Balanced”).
The outputs below are a few select charts snipped out from our Risk Module, available within our technology solution for asset allocators called Portfolio Analytics. Of course, there are myriad ways of using this tool to assess and consider how your portfolios would react under periods of market stress.
Want to learn more?
Please contact Daman Grewal, Senior Relationship Manager at dgrewal@frontieradvisors.com.au if you would like to dive deeper on the allocations, assumptions, scenarios and modelling our clients and consultants use to frame risk and more.


