Build a better long-term portfolio framework
Risk Surface analysis runs thousands of potential strategic asset allocations (SAAs) within the desired allocation constraints. It suggests several improved portfolios based on key metrics and generates a theoretical efficient frontier curve. Additionally, for liability-driven investors (LDI) only, Risk Surface helps allocators balance the return and risk requirements, and capital efficiency needs.
Risk surface was designed by Frontier Advisors’ LDI & Government specialist consulting team and developed in collaboration with Frontier’s dedicated technology business. Risk Surface analysis will be available to all subscribers of Portfolio Analytics and has also been adapted for traditional asset allocators. Portfolio Analytics is a solution designed to solve for asset allocation and multi-asset portfolio construction workflows.
What is Risk Surface analysis, and what does it do?
Based on your SAA and actual asset allocation, along with upper and lower bounds for asset allocation weights, Risk Surface systematically generates thousands of alternative portfolio weights, varying the weights within each of the specific asset classes for each simulation.
The analysis provides outputs for each simulated portfolio, including risk, return, and other important metrics. This allows subscribers to visually consider portfolios that are better positioned toward minimising the frequency of negative annual returns, improving the probability of exceeding the return objective, or maximising risk-adjusted outcomes, amongst other key measures.
Detailed Excel outputs allow users to access the complete asset allocation mix for the simulated portfolios, supporting meaningful discussions and debate on the portfolio framework and the invested portfolio.
Key benefits
- Save time and money by avoiding the need to trial and error asset allocation weights to find portfolios that may or may not produce better outcomes.
- Ability to run thousands of portfolios at once, allowing identification of the better portfolios. Risk Surface analysis provides a visualisation of the following key metrics for the selected asset allocation, and 20 alternative asset allocation mixes to suit:
- Frequency of negative annual return
- Investment return objective
- Probability of exceeding target
- Probability of exceeding CPI
- Sharpe ratio
- Value at Risk
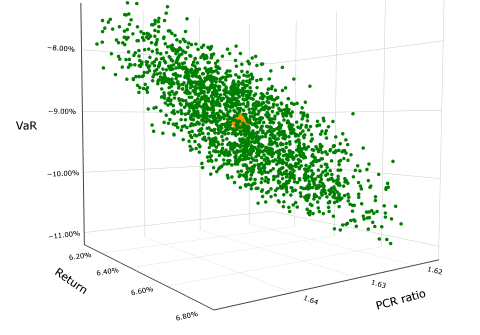
Alternative portfolios versus SAA improving Value at Risk
For LDI subscribers, Risk Surface is an even more powerful and industry relevant tool. The LAGIC framework is front of mind for regulated insurers (life, general and PHI), and a must for analysis alongside traditional return and risk measures. The Risk chart and the 3D Risk Surface charts were designed exclusively for LDI investors for this reason.
- The Risk chart allows users to plot of 6 key metrics versus prudential capital requirement for each of the allocations produced by the risk surface analysis.
- The 3D Risk Surface chart adds a third a dimension, allowing users to toggle VaR levels, to view return, risk and PCR measures to interact and consider potentially better portfolios from multiple dimensions.

Is it an optimiser? Is it just like mean-variance optimisation (MVO)?
The typical portfolio optimiser, underpinned by the maths of mean-variance optimisation, assumes a world with no taxes, no commissions, or put simply a ‘frictionless’ world, which does not exist. Risk Surface analysis is designed to build a better portfolio in the real world.
Risk Surface is not an ‘optimiser’; however, we believe the thousands of simulations can give investment professionals a more realistic understanding of setting an improved long-term portfolio framework. It also helps to highlight some of the trade-offs investors face in the real world.
Where MVO will optimise a return for a given level of risk (standard deviation), investment professionals are concerned about a wide range of measures in getting portfolio settings right. It is not possible to optimise all key metrics for an asset allocator simultaneously and there are trade-offs.
One trade-off example is quite simple. If you want a higher portfolio return, you need to accept higher risk in general. Another trade-off example comes with the desire for more certainty and less tolerance for volatility. Risk Surface analysis highlights the trade-offs and presents multiple portfolios based on the different trade-offs that investors may want to consider.
Explore Risk Surface analysis
To check if you have access, login to your Partners Platform account and open the Portfolio Analytics application. Then select ‘Open a project’ and go to the SAA module to find the new ‘Risk Surface constraints’ section. Then simply input your asset class constraints and click on ‘Analyse’.
Alternatively, get in touch with the Partners Platform Team on pp@frontieradvisors.com.au to arrange a training session.
If you are not a subscriber to Partners Platform, get in touch with your Frontier client team or our specialist, Daman Grewal, CFA, to arrange a discussion on your technology needs or for a tailored demonstration.


